What is the SIF Risk-band?
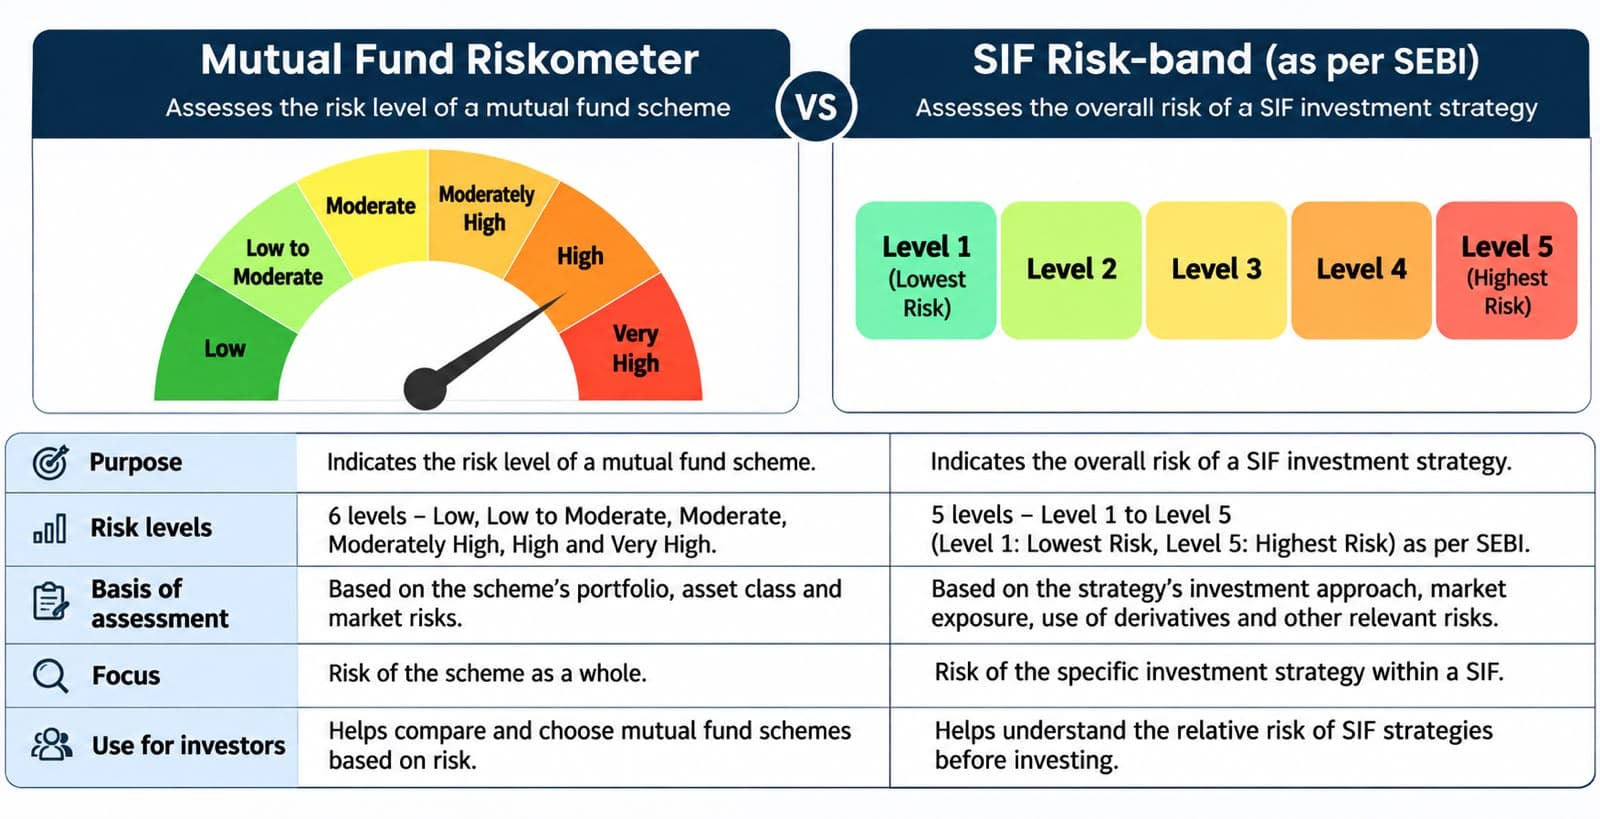
The SIF Risk-band is a five-level risk classification introduced under SEBI’s regulatory framework for Specialised Investment Funds (SIFs). It helps investors understand the assessed risk associated with an individual SIF investment strategy.
Unlike conventional mutual funds, SIFs can use differentiated investment strategies involving long-short positions, derivatives and dynamic asset allocation. These strategies can have different risk characteristics even when they belong to the same broad investment category.
The five levels are:
| Risk-band | Classification |
|---|---|
| Level 1 | Lowest Risk |
| Level 2 | Higher than Level 1 |
| Level 3 | Higher than Level 2 |
| Level 4 | Higher than Level 3 |
| Level 5 | Highest Risk |
What investors should understand: The Risk-band is assigned to each investment strategy, not simply based on whether the SIF belongs to the equity, debt or hybrid category.
It is also subject to monthly evaluation. AMCs must publish the updated Risk-band on their websites and AMFI’s website within 10 calendar days after the end of each month.
If the Risk-band changes, investors must be informed through a notice-cum-addendum and an email or SMS. SIFs must also disclose the risk level as of March 31 every year, along with the number of times it changed during the year.
Definition: SIF Risk-band
The SIF Risk-band is a five-level risk classification prescribed for each Specialised Investment Fund (SIF) investment strategy. It ranges from Level 1 (Lowest Risk) to Level 5 (Highest Risk) and communicates the strategy’s assessed risk based on its portfolio characteristics and a standardised evaluation methodology.
What parameters matter in SIF risk assessment?
SEBI’s framework requires the Risk-band to be evaluated using the prescribed AMFI standards. The assessment is based on the characteristics of the investment strategy’s portfolio.
To understand the risk behind a particular strategy, investors should pay attention to the following dimensions:
- Asset allocation and market exposure
The proportion of the portfolio invested in equity, debt and other permitted asset classes influences its sensitivity to market movements. A strategy with significant equity exposure may respond differently to market corrections than one primarily holding debt securities. - Market volatility
Changes in security prices and the sensitivity of portfolio holdings to market movements can affect the overall risk of a strategy. - Credit risk
Debt-oriented strategies may be exposed to the possibility that an issuer’s credit quality deteriorates or that the issuer fails to meet its payment obligations. - Interest-rate and duration risk
Debt securities are sensitive to changes in interest rates. Longer-duration portfolios generally experience greater price sensitivity to interest-rate movements. - Liquidity risk
The ability to sell portfolio securities without significantly affecting their prices is another important consideration. This is particularly relevant when a strategy holds less liquid securities or has specific redemption windows. - Concentration risk
A portfolio with substantial exposure to a particular stock, sector, issuer or market segment may be more vulnerable to adverse developments affecting that exposure. - Derivative and short-position exposure
The use of futures, options and other permitted derivatives can change the portfolio’s effective market exposure. Short positions also introduce the possibility of losses when the underlying security rises in value.
Important methodology clarification: These are the principal portfolio-risk dimensions investors should examine. They should not be interpreted as a published list of independently weighted scoring variables or as a substitute for AMFI’s detailed Risk-band calculation standards.
The prescribed framework should be used to assess the strategy as a whole rather than judging risk from one portfolio characteristic alone.
SIF Risk-band vs Mutual Fund Riskometer
Investors are already familiar with the Riskometer displayed in mutual fund factsheets. The SIF Risk-band serves a similar purpose: it communicates the assessed risk of an investment strategy.
However, the two frameworks have different scales and assessment methodologies.
| Feature | Mutual Fund Riskometer | SIF Risk-band |
|---|---|---|
| Number of levels | Six | Five |
| Lowest level | Low Risk | Level 1 – Lowest Risk |
| Highest level | Very High Risk | Level 5 – Highest Risk |
| Applies to | Mutual fund scheme | SIF investment strategy |
| Assessment | Prescribed Mutual Fund Riskometer methodology | Prescribed SIF Risk-band methodology |
| Review frequency | Monthly | Monthly |
| Change communication | Through prescribed investor disclosures | Notice-cum-addendum and email/SMS |
| Annual disclosure | Risk level and changes during the year | Risk level as of March 31 and number of changes |
| Public disclosure | AMC and AMFI websites | AMC and AMFI websites |
The six levels of the Mutual Fund Riskometer are:
- Low
- Low to Moderate
- Moderate
- Moderately High
- High
- Very High
The SIF Risk-band, on the other hand, uses five numbered levels, from Lowest Risk to Highest Risk.
Can Level 3 in a SIF be compared with Moderate in a mutual fund?
Not directly.
A SIF at Level 3 cannot automatically be considered equivalent to a mutual fund marked Moderate. The two systems have different assessment frameworks and scales.
Investors should use the respective risk indicators as starting points and then examine the investment strategy, portfolio composition and associated risks.
How should investors use the SIF Risk-band?
The Risk-band is an important starting point for investment research, but it should not be the only factor in an investment decision.
It indicates the assessed risk level of a strategy at a particular point in time. It does not predict future returns, guarantee capital protection or specify the maximum possible loss.
For a more complete assessment, investors should consider:
- Investment Strategy Information Document (ISID): Understand the investment objective, permitted instruments, strategy and associated risks.
- Portfolio disclosures: Examine the securities held, asset allocation and derivative positions.
- Benchmark: Understand the benchmark against which the strategy measures its performance.
- Risk-band history: Check whether the risk level has remained stable or changed frequently.
- Redemption terms: Review redemption frequency and any applicable notice period.
For example, two SIF strategies may carry the same Risk-band but follow very different investment approaches. One could primarily invest in equity securities, while another could use a combination of equity, debt and derivatives.
Therefore, the same Risk-band does not necessarily mean that two strategies have identical risk characteristics.
How do derivatives affect SIF risk?
Derivatives are financial instruments whose value is linked to an underlying asset, such as a stock, index, currency or interest rate.
SIFs can use eligible derivatives for hedging, portfolio rebalancing and taking investment positions.
Their impact on portfolio risk depends on how they are used.
Hedging
A fund manager can use derivatives to protect an existing portfolio position against adverse price movements.
For example, a fund holding shares may use index futures to reduce its exposure to a potential market correction.
Covered calls
A covered call involves holding an underlying security while selling a call option against it. The strategy can generate option premium income but may limit the upside if the security rises significantly.
Arbitrage
Arbitrage strategies seek to benefit from price differences between related securities or markets. These positions can reduce directional market exposure, although execution, liquidity and pricing risks remain.
Unhedged derivative positions
A fund manager can use derivatives to express a market view without holding an equivalent underlying position.
For example, taking a short futures position allows a fund to potentially benefit when the underlying security or index declines. However, if the price rises instead, the position can generate losses.
Therefore, derivatives can either reduce or increase portfolio risk depending on the nature, size and purpose of the positions.
What does the 25% unhedged short exposure limit mean?
One of the distinctive features of SIFs is the ability to take limited unhedged short exposure through eligible exchange-traded derivatives.
Under SEBI’s framework, an SIF investment strategy can take unhedged exposure of up to 25% of its net assets through permissible derivative instruments for purposes other than hedging and portfolio rebalancing.
In simple terms, this allows the fund manager to take a negative view on a security or market by taking an eligible short derivative position.
For example, if a SIF has net assets of ₹100 crore, the permitted unhedged short exposure can be up to ₹25 crore, subject to the applicable strategy-specific and regulatory conditions.
Does this mean SIFs can borrow 25% of their portfolio?
No.
The 25% provision is an allowance for unhedged derivative exposure. It is not permission to borrow an additional 25% of the portfolio or to engage in unrestricted physical short selling.
There is also an overall gross exposure restriction: cumulative gross exposure across the permitted asset classes and instruments must not exceed 100% of the strategy’s net assets.
This distinction is important because unhedged short exposure and leverage are not the same thing.
How can a long-short strategy perform when markets fall?
A long-short strategy can hold securities it expects to appreciate while simultaneously taking short positions in securities it expects to decline.
When markets fall, the short positions may help offset some of the losses from the long portfolio.
Consider a simplified example. Assume a SIF portfolio has:
- Long positions: 80% of NAV
- Unhedged short positions: 20% of NAV
Now assume the broad market declines by 10%, and both the long and short positions move in line with the market.
| Position | Exposure | Assumed market movement | Illustrative NAV impact |
|---|---|---|---|
| Long positions | 80% | Falls 10% | -8% |
| Short positions | 20% | Gains 10% | +2% |
| Combined effect | 60% net long | -6% |
In this illustration, the short position offsets part of the loss on the long portfolio.
A fully invested long-only portfolio experiencing the same 10% market decline would lose approximately 10%.
However, a long-short strategy does not guarantee protection during falling markets.
If the securities held long decline while the securities sold short rise, both sides of the portfolio can generate losses. Similarly, when markets rise, short positions may reduce the portfolio’s overall gains.
Actual results depend on security selection, position sizing, market movements, derivative pricing, execution costs and the correlation between long and short positions.
Risk across the seven SIF investment strategies
SEBI permits seven broad investment strategy categories under the current SIF framework.
Although they operate under the same broad regulatory framework, their investment approaches and risk characteristics can differ significantly.
| SIF investment strategy | Key risks investors should examine |
|---|---|
| Equity Long-Short | Equity market movements, stock selection, concentration, volatility and short positions |
| Equity Ex-Top 100 Long-Short | Mid- and small-cap exposure, liquidity, sharp price movements and short positions |
| Sector Rotation Long-Short | Sector concentration, timing decisions and changes in sector leadership |
| Hybrid Long-Short | Equity and debt allocation, interest-rate risk, credit risk and short positions |
| Active Asset Allocator Long-Short | Asset allocation changes, market timing and fund manager positioning |
| Debt Long-Short | Credit quality, interest rates, duration, liquidity and derivative positions |
| Sectoral Debt Long-Short | Sector concentration, credit events, liquidity and interest-rate risk |
It is important to understand that these are risk considerations, not a regulatory ranking of the seven strategies.
SEBI does not assign a fixed Risk-band to each investment strategy category. The Risk-band is evaluated for every individual strategy and can change as its portfolio characteristics change.
For example, an equity strategy with diversified holdings may have a different risk profile from a concentrated equity strategy. Similarly, debt strategies can carry substantial credit or liquidity risk depending on their underlying securities.
Investors should therefore examine the actual portfolio rather than assuming that one broad category is automatically safer than another.
What are risk-adjusted returns?
Historical returns indicate how much an investment has earned over a particular period. However, they do not tell us how much risk the fund manager took to generate those returns.
Risk-adjusted return measures help investors assess performance in relation to the risk taken.
Consider two SIF strategies:
- Strategy A generates 12% returns but experiences significant fluctuations.
- Strategy B generates 10% returns with comparatively lower fluctuations.
Looking at returns alone would make Strategy A appear better. However, examining the risk involved may provide a different perspective.
Three useful measures are the Sharpe Ratio, Sortino Ratio and Maximum Drawdown.
Sharpe Ratio
The Sharpe Ratio measures the excess return generated by an investment relative to its overall volatility.
A higher Sharpe Ratio generally indicates that the investment has generated more excess return for each unit of total risk taken. It is useful when comparing strategies with similar objectives and measurement periods.
Sortino Ratio
The Sortino Ratio is similar to the Sharpe Ratio, but focuses on downside volatility rather than overall volatility.
It helps investors understand how much return a strategy has generated relative to the risk of negative returns. A higher Sortino Ratio generally indicates better return generation relative to downside risk.
Maximum Drawdown
Maximum Drawdown measures the largest peak-to-trough decline in the value of an investment over a specified period.
For example, if a strategy’s NAV rises to ₹100 and subsequently falls to ₹80 before recovering, its drawdown from that peak is 20%.
It helps investors understand the extent of historical losses they may have experienced while holding the strategy.
An important distinction: These measures complement the SIF Risk-band but do not replace it. They are performance-analysis tools, whereas the Risk-band is a separate regulatory risk classification.
See how live SIFs compare on these measures in our risk-adjusted SIF rankings, or read how to compare SIF returns against benchmarks.
What should investors check before investing in a SIF?
Before investing in a SIF, investors should look beyond the headline Risk-band and examine the investment strategy in detail.
Here is a practical checklist:
- Current Risk-band: Check the latest risk classification and whether it has changed over time.
- Investment objective: Understand what the strategy aims to achieve.
- ISID: Read the Investment Strategy Information Document to understand the permitted investment approach and associated risks.
- Portfolio composition: Examine the latest portfolio, including equity, debt and derivative positions.
- Benchmark: Compare performance against the appropriate benchmark.
- Risk-adjusted returns: Examine the Sharpe Ratio, Sortino Ratio and Maximum Drawdown wherever meaningful historical data is available.
- Liquidity and redemption: Understand the subscription and redemption frequency and any applicable notice period.
- Portfolio suitability: Consider how the SIF strategy fits into your existing investment portfolio, financial objectives and risk appetite.
Ultimately, selecting a SIF should involve understanding the strategy, its potential risks and its suitability for the investor rather than relying solely on historical returns or the Risk-band.
Compare live strategies on risk, returns and fund manager in the SIF fund comparison section.
Frequently asked questions about the SIF Risk-band
Is the SIF Risk-band the same as the Mutual Fund Riskometer?
No. Both communicate investment risk, but the Mutual Fund Riskometer has six levels, while the SIF Risk-band has five. Their assessment methodologies and scales are different.
Does SIF Risk-band Level 1 mean my capital is safe?
No. Level 1 represents the lowest assessed risk on the SIF scale. It does not guarantee capital protection or eliminate the possibility of losses.
Can SIFs take short positions?
Yes. The SIF framework permits unhedged short exposure through eligible exchange-traded derivatives, subject to the applicable limits and conditions.
Does a short position always protect a SIF when markets fall?
No. A short position can generate losses if the underlying security rises in value. Losses can occur on both the long and short sides of a portfolio.
Does SEBI assign a fixed Risk-band to each SIF category?
No. Each investment strategy is assessed individually using the prescribed methodology. Its Risk-band can change as the portfolio characteristics change.
How often is the SIF Risk-band updated?
It is evaluated monthly. AMCs must disclose the updated Risk-band within 10 calendar days after the end of each month.
What is the difference between risk-adjusted returns and the SIF Risk-band?
The Risk-band communicates the assessed risk classification of an investment strategy. Risk-adjusted return measures such as the Sharpe and Sortino ratios evaluate how much return a strategy has generated relative to the risk taken.
Can two SIFs with the same Risk-band have different risks?
Yes. Two strategies with the same Risk-band can have different asset allocations, investment approaches, derivative exposures and underlying securities. Investors should examine the portfolio and strategy documents before comparing them.
From my desk: Neelam Maheshwari
When evaluating a SIF, I would give risk as much attention as returns. The investment strategy, the positions taken and the losses it could face in difficult markets are just as relevant as its performance.
The Risk-band provides a useful starting point, but understanding the portfolio and how the strategy behaves in different market conditions is equally important. Risk-adjusted returns offer another perspective when evaluating a strategy beyond its headline performance.
Disclaimer: Investments in Specialised Investment Funds involve relatively higher risk, including potential loss of capital, liquidity risk and market volatility. Please read all investment strategy-related documents carefully before making an investment decision. This article is for general investor education and does not constitute investment advice.